Cloud Software
A Mixture of AI and Dashboard
Predicta4 Cloud Software: Smart Condition Monitoring
Predicta4’s AI-enabled Cloud Software monitors all collected data and turns them into diagnostic information. P-Cube as a predictive maintenance IoT device, syncs directly with our Cloud. After installing your P-Cube and running the Easy Setup App, the Cloud Software will start to evaluate the status of your machine and no further action needed from your side.
You can view your machine’s historical data and the list of active alerts, and read the reports on our Online Dashboard. It is designed to help you better understand of your machine health and it predicts upcoming failures automatically.
Seamless and Secure Integration
P-Cube, our predictive maintenance IoT device is ready to work out of the box and sync with the Dashboard. All data is sent to the cloud through a highly secure connection
Predictive Maintenance Dashboard
Predicta4 Dashboard provides you with various tools and features that help you establish an optimized and result-oriented predictive maintenance program.
Alert System
Get notifications as soon as an abnormal situation happens for any of your machines. Our Alert System will send you emails and notifications to keep you updated with the latest status of your machinery health condition.
OneView Dashboard
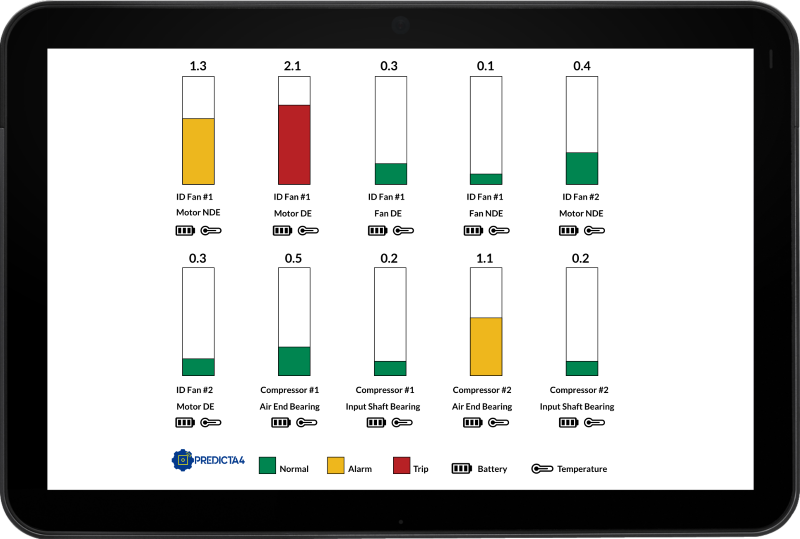
This unique graphical dashboard is designed to be used in control rooms and to provide the operators with the latest machine health status. This feature contains a color coded mechanic that is capable of informing an operator upon potentially faulty sensor detections in real-time.
Make Data-driven Decisions
There is no need to do your own analysis to estimate each alert severity. The Predicta4 dashboard equipped with a color-coded system that quickly provides you with a picture of your machine health.
Once you get that knowledge, you can use it to make data-driven decisions, prioritize actions, and assign your resources based on hourly, daily, and weekly trends. Simple and actionable reporting helps you optimize your machine reliability and get you the highest return on investment of your predictive maintenance program.
Reduce Breakdown and Downtime
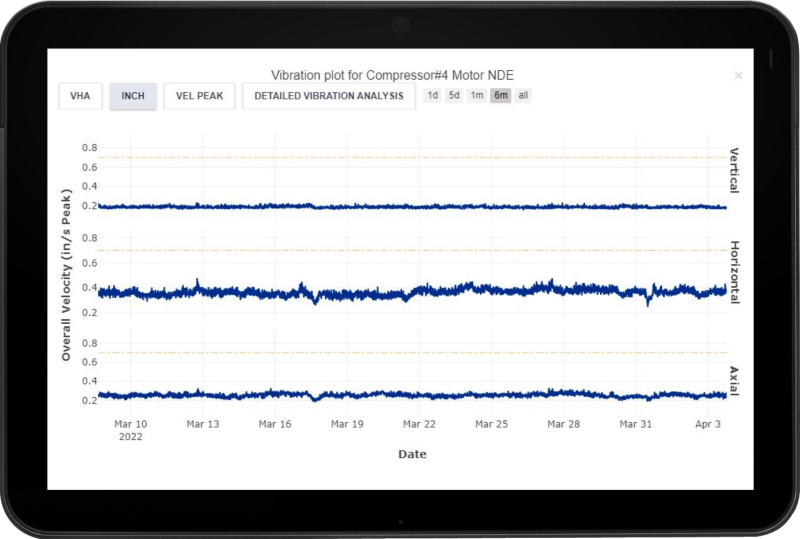
View both historical and real-time data for your machines, or track health trends over any time period that meets your need. Getting access to this data helps you to identify potential failures, decide on the required maintenance actions, and achieve zero breakdown while extending asset life.
Meet Predicta4 Dashboard
Predicta4 Dashboard allows you to have access to the information you need quickly.
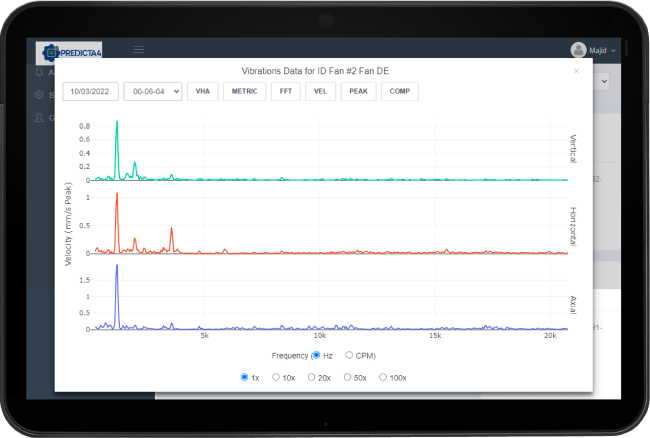
You can view detailed historical data, analytical vibration graphs, alerts list, and various technical reports on our Dashboard.
With the expandable setup and services we provide, you can easily customize the graphical demonstration of your company’s floor plan on the Dashboard.
Predicta4: The Best Predictive Maintenance Dashboard Solution
Predicta4 Dashboard allows you to have access to the various information you need quickly. This includes historical graphs to review machines vibration and temperature trends, analytical graphs to analyze machines faults, and various technical and summary reports.
Predicta4 Dashboard includes various configuration and customization tools to help you optimize it for your team and your application.
User Friendly Dashboard
Predicta4 Dashboard features a user friendly interface for vibration analysts and technicians at your facility. Without much training, registered users can define machines, components, and bearing points where they intend to have P-Cubes installed on.
Historical and Analytical Graphs
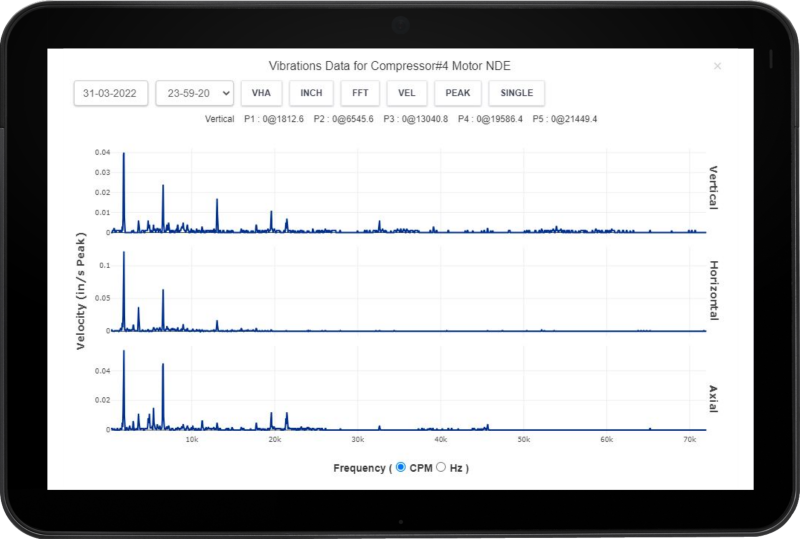
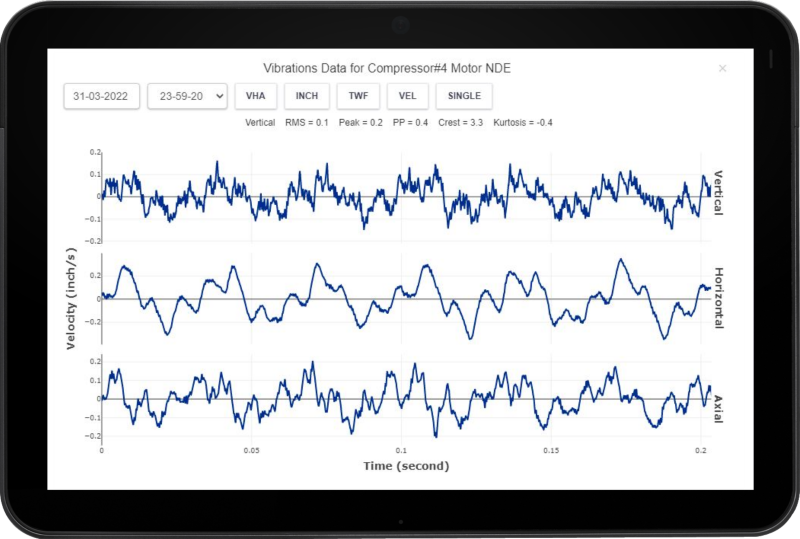
Reviewing machine vibration and temperature trend plots is a critical step in condition monitoring. Analytical graphs such as FFT, Waveform, and demodulation spectrum are used for diagnosing the fault that has caused the abnormal vibration.
Automatic Screening
Predicta4 Dashboard automatically screens machines based on their statuses and puts the machines with higher risk of failure at the top of the Dashboard main page. You can easily locates these machines and take care of them.
P-Cube Configuration
You can see the status of your P-Cubes, and turn them on or off through the Dashboard. You can also add, remove, or configure these small predictive maintenance IoT tools.
Multi-User Based
Provide your maintenance team with separate user accounts to access the Dashboard and receive notifications based on their own preferences and needs.
Multiple Plants/Units
Are your machines located in different plants or units? With our factory/plant layout design solution, we can create multiple graphical Dashboards that each of them represents one of your plants/units throughout your factory.


